

Movements in US 30s/10s curve generally lead 10s/2s despite focus on 10s/2s
The 2021/22 flattening of the US Treasury 10s/2s yield curve, which has been close to full inversion in Q2, has prompted discussion of whether the curve is signaling a recession. In contrast, there is little focus on the 30s/10s yield curve, even though it has generally led movements in the 10s/2s curve, as Chart 1 shows.
Chart 1: The 30s/10s yield curve has generally led movements in 10s/2s curve

Source: FactSet
Chart 1 also shows some similarity between recent bear flattening* yields rising more in 2 yrs than 10 yrs - and the 10s/2s flattening in 2018. The 30s/10s yield curve has also been flatter than 10s/2s for most of the last 12 months, as it was during the bear flattening in 2017/18.
But yield curve dynamics and the Fed's policy cycle also show distinct differences in 2022, from 2018/19. Then, markets moved quickly to price in lower 10 year and 2 year yields once growth began to slow, effectively front-running Fed policy easing, with no inflation problem to consider. The 10s/2s yield curve then bull flattened**, in the late-cycle move, pre-COVID. In 2022 however, the 10s/2s yield curve has steepened since early April, the Fed has only just begun tightening and is dealing with a major inflation shock, and there is no clarity on where the terminal rate for Fed tightening will prove to be. The Fed's dot plot projections have already been revised steadily higher, in line with the higher inflation forecasts.
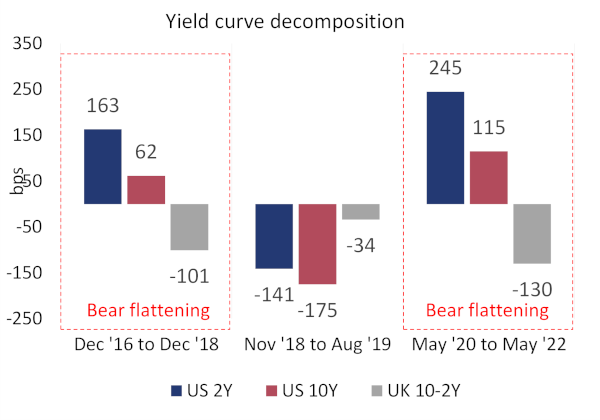
Chart 2 compares the bear flattenings of the US 10s/2s curve in 2021/22 and 2016/18 and shows greater curve flattening in 2021/22, as 2yr yields have risen about 80bp more, even if 10 yr yields have also risen more than in 2016/18. The bigger yield moves have also occurred within the same 24 month timeframe in 2020/22, as 2016/18, so the move has been relatively faster.
Chart 2: 2021/22 bear flattening exceeds 2016/18, but when will a bear become a bull?
Source: FactSet
This has helped drive a faster tightening in financial conditions but bull flattening of the yield curve has not yet occurred. Although Treasury yields, and inflation breakevens, have fallen in the May rally, this has caused the 10s/2s curve to steepen - see Chart 1 - whereas bull flattening proved the key signal for weaker economic growth in 2018/19.
*A bear flattening of the yield curve occurs when short dated yields (eg, 2 yrs) rise more than longer dated (e.g. 10 yrs).
**A bull flattening of the yield curve occurs when short dated yields fall less than longer dated yields.
Index 15303321 E0922

Stung by the persistency and level of inflation and the accusation of being behind the curve the Federal reserve has cranked up its hawkishness
This is reflected in a significant shift in market interest rate expectations since the Russian invasion of Ukraine in late February.
Chart 1: A significant shift in US interest rate expectations since late February

Source: Refinitiv
The next few FOMC meetings are expected to deliver 50bps increases in the Fed funds and see the contraction of both Treasury and MBS holdings.
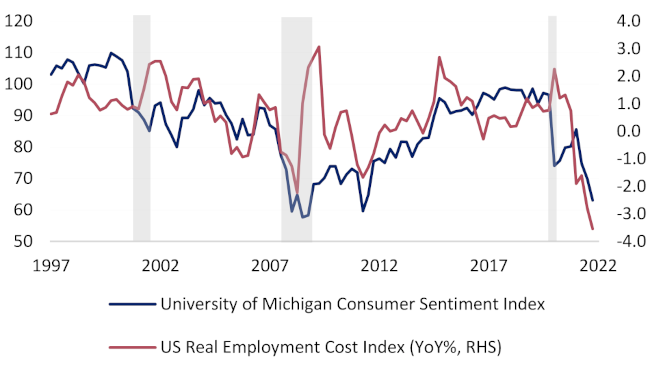
What is unusual is that the Fed are tightening at a time when both Consumer Confidence and Real Incomes have fallen to levels last seen at the lows of the GFC recession. Normally the Fed would be considering accommodation with indicators at these levels.
Chart2: The Fed are tightening into extremely weak Consumer Confidence and Real Income levels
Source: Refinitiv
Another clear risk is that the Fed have turned more hawkish just as aggregate financial conditions ( a measure of the combined impact of shifts in monetary policy, the credit cycle and foreign exchange) have tightened very rapidly( much faster than during the previous cycle) and are on the cusp of turning restrictive.
Chart 3: US FCI's have risen very rapidly and are on the cusp of turning restrictive.

Source: Refinitiv
When rates are seen as above the neutral rate each incremental move is seen as creating significant headwinds for subsequent growth. Gauging neutral rates by measuring the ratio between consensus nominal GDP growth rates and terminal interest rate forecasts the US is now at neutral rate levels.
Any more tightening from here could start to be perceived a policy mistake.
Chart 4: US rates are already approaching 'neutral' levels

Source: Refinitiv
Index 15303321 E0922

Wilshire has been applying highly tested theories and approaches to our client solutions since 1981.
You can count on our team of experts to help improve investment outcomes for a better future.