
Movements in US 30s/10s curve generally lead 10s/2s despite focus on 10s/2s
The 2021/22 flattening of the US Treasury 10s/2s yield curve, which has been close to full inversion in Q2, has prompted discussion of whether the curve is signaling a recession. In contrast, there is little focus on the 30s/10s yield curve, even though it has generally led movements in the 10s/2s curve, as Chart 1 shows.
Chart 1: The 30s/10s yield curve has generally led movements in 10s/2s curve

Source: FactSet
Chart 1 also shows some similarity between recent bear flattening* yields rising more in 2 yrs than 10 yrs - and the 10s/2s flattening in 2018. The 30s/10s yield curve has also been flatter than 10s/2s for most of the last 12 months, as it was during the bear flattening in 2017/18.
But yield curve dynamics and the Fed's policy cycle also show distinct differences in 2022, from 2018/19. Then, markets moved quickly to price in lower 10 year and 2 year yields once growth began to slow, effectively front-running Fed policy easing, with no inflation problem to consider. The 10s/2s yield curve then bull flattened**, in the late-cycle move, pre-COVID. In 2022 however, the 10s/2s yield curve has steepened since early April, the Fed has only just begun tightening and is dealing with a major inflation shock, and there is no clarity on where the terminal rate for Fed tightening will prove to be. The Fed's dot plot projections have already been revised steadily higher, in line with the higher inflation forecasts.
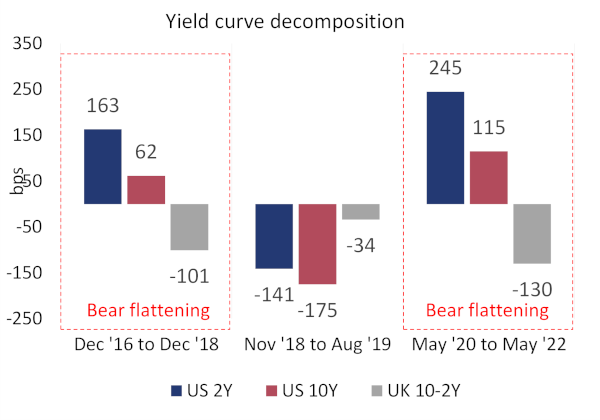
Chart 2 compares the bear flattenings of the US 10s/2s curve in 2021/22 and 2016/18 and shows greater curve flattening in 2021/22, as 2yr yields have risen about 80bp more, even if 10 yr yields have also risen more than in 2016/18. The bigger yield moves have also occurred within the same 24 month timeframe in 2020/22, as 2016/18, so the move has been relatively faster.
Chart 2: 2021/22 bear flattening exceeds 2016/18, but when will a bear become a bull?
Source: FactSet
This has helped drive a faster tightening in financial conditions but bull flattening of the yield curve has not yet occurred. Although Treasury yields, and inflation breakevens, have fallen in the May rally, this has caused the 10s/2s curve to steepen - see Chart 1 - whereas bull flattening proved the key signal for weaker economic growth in 2018/19.
*A bear flattening of the yield curve occurs when short dated yields (eg, 2 yrs) rise more than longer dated (e.g. 10 yrs).
**A bull flattening of the yield curve occurs when short dated yields fall less than longer dated yields.
Index 15303321 E0922

Important Information
Wilshire is a global financial services firm providing diverse services to various types of investors and intermediaries. Wilshire’s products, services, investment approach and advice may differ between clients and all of Wilshire’s products and services may not be available to all clients. For more information regarding Wilshire’s services, please see Wilshire’s ADV Part 2 available at www.wilshire.com/ADV.
This material is intended for informational purposes only and should not be construed as legal, accounting, tax, investment, or other professional advice.
This material contains proprietary information of Wilshire. It may not be disclosed, reproduced, or otherwise distributed, in whole or in part, to any other person or entity without prior written permission from Wilshire.
This material represents the current opinion of Wilshire and is subject to change without notice. Wilshire assumes no duty to update any such opinions. Wilshire believes that the information obtained from third party sources contained herein is reliable, but has not undertaken to verify such information. Wilshire gives no representations or warranties as to the accuracy of such information, and accepts no responsibility or liability (including for indirect, consequential or incidental damages) for any error,omission or inaccuracy in such information and for results obtained from its use.
This material may include estimates, projections, assumptions and other "forward-looking statements". Forward-looking statements represent Wilshire's current beliefs and opinions in respect of potentialfuture events. These statements are not guarantees of future performance and undue reliance should not be placed on them. Such forward-looking statements necessarily involve known and unknown risks and uncertainties, which may cause actual events, performance and financial results to differ materially from any projections. Forward-looking statements speak only as of the date on which they are made and are subject to change without notice. Wilshire undertakes no obligation to update or revise any forward-looking statements.
Wilshire Advisors LLC (Wilshire) is an investment advisor registered with the SEC. Wilshire® is a registered service mark. All other trade names, trademarks, and/or service marks are the property of their respective holders.
Copyright © 2022 Wilshire. All rights reserved.

While July saw a rally in most equity market regions (with the notable exception of China), the notable performance was delivered by US equities which outperformed the World ex US index by 5.8%.
Chart 1: Comparing regional equity returns in July (USD, TR, %)

Source: Refinitiv, FactSet
Looking at 10-year annualized returns US equities have delivered 13%, more than twice the 5.9% return from the World ex US.
Chart 2: Regional 10-year aggregate and annualized returns (USD, TR, %)

Source: Refinitiv, FactSet
The rally in the US relative performance in July saw it rebound back to levels seen earlier this year. By contrast, Emerging Market relative performance weakened
Chart 3: Relative performance charts for the US and Emerging Markets

Source: Refinitiv, FactSet
To identify the driver of US equity outperformance in July, it is useful to utilize sector weighted performance contribution analysis. Exhibit 4 compares the sector weighted contributions for the US and the World ex US indexes. The majority of the almost 6% outperformance of US equities in July was almost entirely due to the scale of contributions from the Technology and Consumer Discretionary sectors.
Chart 4: Sector weighted performance contributions US and World ex US for July

Source: Refinitiv, FactSet
Index 15303321 E0922
Low beta and Value were the best performing factors with momentum lagging. The "Pure" quality factor also outperformed reflecting increased risk aversion. The 16% outperformance of the Value style relative to Growth was a notable feature of the first half of the year.
The first half of 2022 produced large rotation in factors utilizing the FT Wilshire "Pure" factor methodology and data. In terms of relative performance, the Low Beta and Value Factors outperformed the most (responding to rising real yields) with the momentum factor underperforming significantly.
Interestingly the "Pure" Quality factor outperformed as well (unlike most other Quality Factor indices) - this reflects the Pure Factor methodology stripping away unintended sector and factor exposures. The outperformance of the quality factor reflected the desire to seek protection against recessionary headwinds.
Chart 1: Pure factor relative performance YTD

Source: Wilshire
Value has persistently outperformed while quality outperformed strongly in Q2. By contrast Momentum declined significantly in Q2 .
Chart 2: Relative return of Pure Factors YTD

Source: Wilshire
In terms of the size indices large and small delivered similar returns YTD with Micro cap slightly underperforming. The scale of the Value style outperformance was the key feature in the first half of 2022.
Chart 3: FT Wilshire 5000 size and style returns

Source: Wilshire
A notable feature of 2022 market dynamics has been the 16% outperformance of Value relative to Growth. The Growth /Value relative return ratio appears to be returning to pre-Covid levels
Chart 4: Growth Style Index returns relative to Value

Source: Wilshire
Index 15303321 E0922
A key feature of the sell off was the rotation out of long duration growth and tech stocks in response to rising real yields. It also produced a statistically significant decline in PE valuation.
As at the close on June 30th 2022 the FT Wilshire 5000 index delivered a negative return of -20.9% for the first half of the year. Most of the negative return was delivered by the substantial Q2 correction of -16.8% as market sentiment reacted to mounting stagflation angst and increasingly hawkish Federal Reserve guidance.
Chart 1: The largest half year correction on record

Source: Wilshire, Refinitiv
Chart 2: The correction has rewound the index back to February 2021 levels:

Source: Wilshire, Refinitiv, FactSet
However, despite the pullback US equities have still delivered strong nominal and real long-term returns measured on both an aggregate and annualized basis.
Chart 3: Strong long term Nominal and Real returns

Source: Wilshire, Refinitiv, FactSet
A significant element of the correction was driven by a rotation out of long duration growth and technology stocks as real yields increased
Chart 4: Rising Real Yields have led to Growth stock underperformance/Value stock performance

Source: Wilshire, Refinitiv, FactSet
The growth stock underperformance was dominated by the negative sector weighted performance contribution delivered by the Digital Information, Technology and Consumer Goods and Services sectors. Only the Energy sector posted a positive return contribution YTD.
Chart 5: FT Wilshire 500 Sector Weighted Performance Contributions YTD

Source: Wilshire
The correction has produced a significant and rapid PE decline - producing a rarely seen 3 standard deviation move.
Chart 6: A rapid and large decline in the PE valuation

Source: Refinitiv, FactSet

Wilshire has been applying highly tested theories and approaches to our client solutions since 1981.
You can count on our team of experts to help improve investment outcomes for a better future.