

The scale of decline in valuations was one of the largest de-ratings witnessed in 30 years
As can be seen in Chart 1 the US and UK markets witnessed the largest proportionate decline in their PE levels comparing mid - year valuations with those as at year end 2021.The US PE valuation has fallen -26.8% from 22.5x to 16.4x over a six-month period.
Chart 1: Regional 12M PE ratios - now v levels at the end of 2021

Measuring the six month change in the market PE and comparing this to historical moves we can see in Chart 2 that the recent decline US has experienced a statistically significant (3 standard deviation) valuation correction. This is one of the largest moves over the last 30 years.
Chart 2: Measuring the 6-month change in the US 12M PE

Chart 3 below decomposes market return drivers into three categories - the contribution of changes to EPS forecasts, Dividends and Valuations. YTD data as at end June 2022 clearly shows the scale of performance drag delivered by the decline in PE valuations
Chart 3: YTD regional market return decomposition

A function of the US market experiencing a proportionately large PE de-rating is that it has seen its PE relative premium (comparing the PE of the US market to that of the World ex US market) decline from a peak of 55% in March this year to a current level of 32%.
By contrast the PE relative for Emerging Markets has moved from a c. 20% discount to parity - something last seen in 2016.
Chart 4: PE relatives comparisons

Index 15303321 E0922
Consensus EPS growth forecasts have been resilient - is this reassuring or highlighting the risk that an EPS downgrading cycle is yet to commmence?
Despite the significant economic, monetary policy and geo-political induced volatility in equity markets in the first half of 2022, consensus EPS growth forecasts have been remarkably resilient. Is this reassuring or is it highlighting the risk that an EPS downgrading cycle is yet to commence?
Chart 1 shows the status of regional market consensus EPS growth forecasts for this year and next and measures the revisions (deltas) to the forecasts made at the end of last year. US growth forecasts have hardly changed over the last six months.
Chart 1: Regional consensus EPS growth forecasts

Source: Refinitiv, FactSet
The US 2022 and 2023EPS trails emphasize the steadiness in the forecasts over the last few months - showing no impact (so far) from the uncertainty and volatility of the market.
Chart 2: US Estimate trails

Source: Refinitiv, FactSet
The resilience in consensus forecasts could be providing a false sense of security. One of the key areas of concern is that analysts have a poor track record in predicting macro driven falls in EPS.
Chart 3 compares consensus12M forward EPS forecasts with trailing (reported EPS), and the forward estimates tend to follow (not lead) reported EPS down. Are analysts waiting for guidance and reported data to decline before they start reducing their forecasts?
Chart 3: Comparing US consensus EPS forecasts to reported (lagging) EPS

Source: Refinitiv, FactSet
The significant rise in input prices (both labor costs and materials) creates top-down headwinds for corporate margins. Some find it hard to reconcile these headwinds with unchanged EPS estimates.
Chart 4: US labor costs and input prices

Source: Refinitiv, FactSet
Index 15303321 E0922

Stung by the persistency and level of inflation and the accusation of being behind the curve the Federal reserve has cranked up its hawkishness
This is reflected in a significant shift in market interest rate expectations since the Russian invasion of Ukraine in late February.
Chart 1: A significant shift in US interest rate expectations since late February

Source: Refinitiv
The next few FOMC meetings are expected to deliver 50bps increases in the Fed funds and see the contraction of both Treasury and MBS holdings.
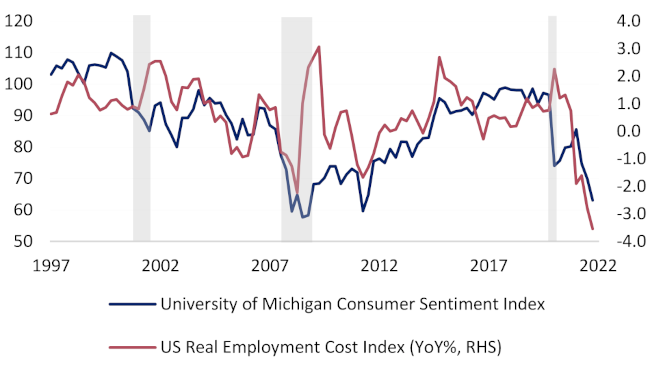
What is unusual is that the Fed are tightening at a time when both Consumer Confidence and Real Incomes have fallen to levels last seen at the lows of the GFC recession. Normally the Fed would be considering accommodation with indicators at these levels.
Chart2: The Fed are tightening into extremely weak Consumer Confidence and Real Income levels
Source: Refinitiv
Another clear risk is that the Fed have turned more hawkish just as aggregate financial conditions ( a measure of the combined impact of shifts in monetary policy, the credit cycle and foreign exchange) have tightened very rapidly( much faster than during the previous cycle) and are on the cusp of turning restrictive.
Chart 3: US FCI's have risen very rapidly and are on the cusp of turning restrictive.

Source: Refinitiv
When rates are seen as above the neutral rate each incremental move is seen as creating significant headwinds for subsequent growth. Gauging neutral rates by measuring the ratio between consensus nominal GDP growth rates and terminal interest rate forecasts the US is now at neutral rate levels.
Any more tightening from here could start to be perceived a policy mistake.
Chart 4: US rates are already approaching 'neutral' levels

Source: Refinitiv
Index 15303321 E0922

Wilshire has been applying highly tested theories and approaches to our client solutions since 1981.
You can count on our team of experts to help improve investment outcomes for a better future.